Buying Selling Volume v2Builds on Ceyhun's "Buying Selling Volume" indicator. This version allows users to define periods by effortlessly dragging two points or you may define periods by manually entering the start and end times in the settings window. Once the period is defined, both buying and selling volume will be totaled thus displaying the amount of buys and sells in that period.
I have found the information provided from the script helps in defining a period of consolidation as either being accumulative or distributive.
Buscar en scripts para "Buy sell"

Buying/Selling Pressure & Trend Strength/Direction (Zeiierman)█ Overview
Buying/Selling Pressure & Trend Strength/Direction (Zeiierman) transforms price behavior into a continuous, evolving map of bullish and bearish pressure. The system breaks every candle into internal buying pressure, selling pressure, net dominance, and the broader structural trend environment. These elements combine into a unified visual structure that reveals how actively each side participates and how organized or fragmented the underlying trend has become.
Long/Short Covered visualization adds an additional layer of insight by highlighting moments when traders unwind positions, often exposing squeeze conditions, exhaustion zones, or developing turning points before they appear in price alone.
⚪ Why This One Is Unique
This system stands out because it reconstructs market pressure from multiple directional components rather than relying on a single trend or momentum source. Instead of treating bullish and bearish movement as a simple up/down outcome, it forms a dual-sided pressure environment that adapts to how each side is behaving relative to its own historical structure. This produces a fluid, context-aware representation of participation that moves with the market instead of fighting it.
The anomaly-based Long/Short Covered component adds another layer of uniqueness. Rather than flagging spikes mechanically, it evaluates how current pressure behavior deviates from expected balance and highlights when traders are being forced out of positions. This produces a highly intuitive map of squeeze events, capitulation, and exhaustion dynamics.
█ Main Features
⚪ Buying/Selling Pressure Candles
Visualize the balance between bullish and bearish pressure as oscillator-style candles. Traders use these to quickly see whether current bars are dominated by buying or selling aggression and how strong that pressure is relative to recent history.
Fast Trend: A highly responsive trend layer that reflects short-term pressure shifts. Use it as the earliest indication of changing momentum and as a guide for deciding whether to participate in the developing pressure move or wait for stronger confirmation.
Core Trend: The underlying long-term pressure trend that reveals the broader market direction. Values above zero indicate a bullish regime, while values below zero indicate a bearish regime. Use the Core Trend to align your trades in the same direction as the dominant market trend.
Strong Trend: Strong Trend highlights periods of unusually intense and extended trend movement. These moves can continue for a while, but they often signal that the trend is becoming stretched. Extended Strong Trend conditions can precede exhaustion, deeper pullbacks, or even full reversals, so traders should remain cautious when these appear.
Established Trend: Identifies areas where market pressure has matured into a well-developed directional trend. Use this as a high-confidence confirmation layer. If the Established Trend begins to fade or stop printing while the price weakens, it can be an early sign that a pullback or reversal is approaching.
⚪ Long/Short Covered
Highlights candles where the pressure structure suggests aggressive unwinding of existing positions (longs or shorts). These zones often align with sharp spikes, squeezes, or capitulation and can be used to time reversals, profit-taking, or fade extreme moves.
⚪ Pressure Changes
Pressure Cross
Pressure Cross events show clear shifts where one side’s pressure overtakes the other. They signal that the balance of force is changing, but they still require confirmation from the Fast or Established Trend before being used as entry triggers or position add-ons.
Pre Signals
Pre Signals appear even earlier and highlight the first hints of pressure building in the opposite direction. They act as early heads-up alerts that may reflect short-term fluctuations, so traders should wait for additional confirmation before treating them as meaningful trend movement.
█ How to Use
⚪ Breakout/Momentum Trading (Buying and Selling Pressure)
Buying and selling pressure is displayed directly through the pressure candlesticks. The stronger the coloring, the stronger the force behind the move. This makes it easy to see which side is in control and whether the market is building enough pressure for a breakout or continuation. Traders can use this to gauge the strength of a move and align their entries with the dominant side of the market.
Breakout Trading
When strong green pressure candles appear as the price approaches resistance, it shows that buyers are actively pushing the breakout. Likewise, strong red pressure candles during a breakdown indicate decisive selling pressure. These surges help confirm whether a breakout has real strength behind it and reduce the chances of entering weak or false moves.
Bullish Breakout
Bearish Breakout
Momentum Trading
The deeper the candle coloration, the stronger the underlying momentum. Intense green candles reflect an accelerating bullish drive, while intense red candles reflect an accelerating bearish drive. Traders can use these moments to enter in the direction of momentum, focusing on strong moves that are more likely to continue.
Note: To capture longer and more sustained momentum moves, increase the candle length above 30.
⚪ Trend Trading
The indicator provides several components to evaluate trend direction and trend maturity. The pressure candlesticks and the Core Trend form the foundation of trend detection, while the Established Trend and Strong Trend features help confirm when a trend has developed into a mature, sustained phase. These layers together help identify trends with a higher likelihood of continuation or potential exhaustion when the move becomes extended.
Note: To capture longer and more sustained trend moves, increase the candle length above 30. You can also raise the Smoothed value into the 10–30 range for additional stability.
Candlesticks or Fast Trend
The pressure candlesticks and the Fast Trend can both be used to read trend direction. When green candles dominate and extend above the +200 region, and the Fast Trend is rising while red candles stay above the −200 region, the market is operating in a bullish environment. When red candles dominate below the −200 region, and the Fast Trend is falling while green candles stay below the +200 region, the environment is bearish. Stronger candle coloration and a firmly aligned Fast Trend both signal stronger trend behavior.
Core Trend
The Core Trend complements the candlesticks by offering a clear background bias. Green histogram bars indicate bullish conditions, while red histogram bars indicate bearish conditions. Traders can use the Core Trend to validate whether the pressure structure aligns with the broader directional bias.
⚪ Pressure Changes
Pressure Changes highlight moments where buying and selling pressure begin shifting from one side to the other. These movements often appear before trend transitions, but they are not trend reversals by default. Instead, they reveal temporary or emerging changes in pressure that may or may not develop into a lasting move. Traders should treat these signals as early information that needs further confirmation.
Pressure Cross events mark clear shifts where one side’s pressure overtakes the other. These events show that the balance of force is changing, but they do not guarantee a sustained trend reversal. Traders should confirm the shift by checking alignment with the Fast Trend, Core Trend, or Established Trend before acting on the signal.
Pre Signals appear even earlier than Pressure Cross events and highlight the first hints of pressure building in the opposite direction. These signals offer early awareness but can represent short-term fluctuations rather than meaningful shifts. Traders should use them as heads-up alerts and rely on additional confirmation tools to determine whether the pressure change will evolve into a genuine trend movement.
⚪ Reversal/Pullback Trading (Long/Short Covered)
Long traders eventually need to sell, and short traders eventually need to buy back. These actions can create meaningful pressure spikes that often appear near reversal zones or trend pullback areas.
Long Covered events tend to occur when long positions are being unwound, often marking potential reversal points or areas where price may find support within an existing uptrend. This can provide early clues that the current move is losing steam or preparing to reset.
Short Covered events tend to occur when short positions are being closed, often appearing near resistance zones or within strong downtrends where the market temporarily retraces. These signals can act as early warnings of pullbacks or exhaustion within broader bearish flows.
⚪ Overbought/Oversold
When the pressure candles reach the upper or lower limits, the market may be entering an extended condition. These zones often precede pauses, pullbacks, or full reversals, depending on the broader context. Traders can treat these boundaries as early caution areas where strong moves may temporarily lose strength.
⚪ Divergence Trading
The pressure candles naturally highlight divergences. When price makes a new high or low but the pressure candles fail to confirm with equally strong activity, it suggests that buying or selling pressure is fading. These divergence patterns can help traders identify potential reversal points or weakening momentum in ongoing trends.
█ How It Works
⚪ Buying/Selling Pressure
The indicator reframes each bar through a two-channel transformation that separately models bullish and bearish pressure. Instead of interpreting movement as a single directional value, the system generates a pair of opposing pressure streams that evolve against each other. This creates a dynamic field where dominance, imbalance, acceleration, and exhaustion can be observed simultaneously.
Calculation: Constructs a bi-directional pressure surface using normalized displacement relationships, volatility-adjusted scaling, and directional competition modeling.
⚪ Adaptive Strength Normalization
To avoid flat readings, each side’s pressure is evaluated relative to its own historical envelope, producing a normalized strength scale. This allows the model to interpret current motion in the context of what has recently been “strong” or “weak,” rather than relying on static reference levels.
Calculation: Applies rolling extremum mapping and nonlinear rescaling, converting raw directional activity into a bounded strength metric that reflects real-time contextual significance.
⚪ Geometric Trend Core Engine
Trend state is derived by combining directional pressure into a geometrically structured core. This core reacts not only to direction but to symmetry, dispersion, and slope of the pressure environment. When the core flattens while pressure expands, the system recognizes structural organization, flagging strong trends.
Calculation: Uses geometric mean transformations and smoothed envelope interactions to build a stable trend backbone that identifies when movement transitions from noise into coordinated directional behavior.
⚪ Long/Short Covered Anomaly
Long/Short Covered events emerge from a comparison of expected vs. actual pressure symmetry. When bullish and bearish gradients diverge beyond a context-defined limit, the system interprets it as forced unwinding or aggressive covering. These anomalies often signal structural stress, squeezes, or capitulation.
Calculation: Implements a bidirectional gradient comparison model, where deviation from the neutral equilibrium curve produces a significance score. If this score exceeds its adaptive threshold, an anomaly event is triggered.
-----------------
Disclaimer
The content provided in my scripts, indicators, ideas, algorithms, and systems is for educational and informational purposes only. It does not constitute financial advice, investment recommendations, or a solicitation to buy or sell any financial instruments. I will not accept liability for any loss or damage, including without limitation any loss of profit, which may arise directly or indirectly from the use of or reliance on such information.
All investments involve risk, and the past performance of a security, industry, sector, market, financial product, trading strategy, backtest, or individual's trading does not guarantee future results or returns. Investors are fully responsible for any investment decisions they make. Such decisions should be based solely on an evaluation of their financial circumstances, investment objectives, risk tolerance, and liquidity needs.
Script de pago

Buy/Sell Volume - TradingriotThis indicator estimates buy-side and sell-side volume using a RangeSplit model. Since TradingView does not provide true bid/ask aggressor data, the script allocates each bar’s volume based on where the close sits within the bar’s high–low range. The closer the close is to the high, the more of that bar’s volume is attributed to buying pressure. The closer it is to the low, the more is attributed to selling pressure.
How it works
Compute the bar’s total range
range = high − low
Locate the close inside that range
fraction = (close − low) / range
Allocate volume
Buy Volume = volume × fraction
Sell Volume = volume × (1 − fraction)
Apply an optional EMA smooth to stabilize the signals.
Plots
Buy Volume (green columns) – estimated buy-side participation
Sell Volume (red columns) – estimated sell-side participation
Delta Line (gray) – smoothed difference between buy and sell volume
Zero line – helps identify positive or negative volume imbalance
Use-case
This gives a quick visual read of dominant pressure inside each bar without relying on unreliable raw volume bars. It can help highlight shifts in control, volume imbalances, and momentum transitions on higher timeframes.
Limitations
This is a proxy, not true buy/sell volume. It does not access bid/ask or time-and-sales data. It simply distributes total volume by candle geometry.
If you want a clean and simple way to visualize who likely controlled the bar, this is as far as TradingView can go using OHLCV data.

Buying/Selling Detector [BruzX]█ OVERVIEW
This indicator aims to provide a visual and numerical representation of the strength of buying or selling of a security. It does this by calculating and accumulating a bar-by-bar metric and is based on a a conjecture (explained in the Concepts section) about how price and volume reacts to buying and selling behaviour.
█ FEATURES
Shows strength of buying/selling (on a scale between -100 to +100, before smoothing) on a separate plot and on the info box
Shows the metric on three different timescales: since the session open, since a user defined start time and using a rolling relative moving average over the last bars.
The info box has a background colour corresponding to the strength of buying/selling
█ HOW TO USE
When the indicator is added it appears in a separate pane showing a historical plot of the metric values. If preferred, only the info box can be used as an overlay on the main chart. To do this, disable all the lines in the settings, and move the indicator to the main pane.
There are several options:
Boost: This controls the strength of a non-linear operation applied to price bars.
Volume factor: This controls to what extent the volume influences the the metric.
Rolling RMA length (bars): This controls the number of bars used for the rolling relative moving average metric.
Scaling factor RMA length (days): This controls the metric scaling so that it remains within -100 and +100 (note: some visual smoothing methods, notable HMA, can cause spikes outside this range). It specifies the number of days back to use to calculating a "usual" metric value for current bar.
User Start Time: This controls the start time for accumulating the user metric. Default is 10:30, which is the end of the initial balance. Another interesting start time could be, for example, 09:31 to exclude MOO price action and volume.
Smoothing: Purely visual smoothing to prevent rapid swings.
Neutral band: Controls the width of the visual neutral level (coloured yellow by default, user can change this), where the values of the metric are considered insignificant. Default is 10, meaning metric values between -10 and +10 will be yellow.
One way to use the indicator is to watch for divergences between highs/lows on the indicator compared to high/low on the price, in a similar to how MACD is sometimes used. For example, if the price makes a new high, but this indicator does not, it may indicate a pending reversal.
Another frequent pattern is to watch for spikes, which often indicate an absorption or at least the start of a consolidation (depending on what happens after the spike). Absorption often leads to a reversal, whereas consolidations often continue, e.g. an ABCD or flag pattern.
█ CONCEPTS
There is a conjecture behind the indicator which states that dominant buying or selling can identified by the price and volume behaviour. It is a concept used in Volume Price Analysis, as popularised by the author Anna Coulling. Basically it says that dominant buying, for example, can be identified by rapid upward price movement (compared to the speed of downward movement) on high volume. To create a metric from this concept a non-linear operation (controlled by the Boost option) is used to quantify the strength of the price movement. The effect of volume is then also applied to this metric and a non-linear operation is used for this too (controlled by the Volume factor option).
█ DISCLAIMER
This indicator is provided for information only and should not be used in isolation without considering other factors. You should not take trades using real money based solely on what this indicator says. Any trades you take are entirely at your own risk.

Buy/Sell Demand Pressure SMAThis indicator shows when competing buying and selling pressure has changed.
When bullish buying offsets bearish transaction volume, the indicator turns green. When bearish selling pressure offsets bullish buying volume the indicator is red.
Can be used as a normal SMA or to confirm buy/sell signals of other indicators.
Works best at the start of trades...and not exits but if set properly, it is a good indicator of when a trend has reversed.
~ jb tuttle

Buy/Sell Signals (MACD + RSI) 1HThis is a Pine Script indicator for TradingView that plots Buy/Sell signals based on the combination of MACD and RSI indicators on a 1-hour chart.
Description of the Code:
Indicator Setup:
The script is set to overlay the Buy/Sell signals directly on the price chart (using overlay=true).
The indicator is named "Buy/Sell Signals (MACD + RSI) 1H".
MACD Settings:
The MACD (Moving Average Convergence Divergence) uses standard settings of:
Fast Length: 12
Slow Length: 26
Signal Line Smoothing: 9
The MACD line and the Signal line are calculated using the ta.macd() function.
RSI Settings:
The RSI (Relative Strength Index) is calculated with a 14-period setting using the ta.rsi() function.
Buy/Sell Conditions:
Buy Signal:
Triggered when the MACD line crosses above the Signal line (Golden Cross).
RSI value is below 50.
Sell Signal:
Triggered when the MACD line crosses below the Signal line (Dead Cross).
RSI value is above 50.
Signal Visualization:
Buy Signals:
Green "BUY" labels are plotted below the price bars where the Buy conditions are met.
Sell Signals:
Red "SELL" labels are plotted above the price bars where the Sell conditions are met.
Chart Timeframe:
While the code itself doesn't enforce a specific timeframe, the name indicates that this indicator is intended to be used on a 1-hour chart.
To use it effectively, apply the script on a 1-hour chart in TradingView.
How It Works:
This indicator combines MACD and RSI to generate Buy/Sell signals:
The MACD identifies potential trend changes or momentum shifts (via crossovers).
The RSI ensures that Buy/Sell signals align with broader momentum (e.g., Buy when RSI < 50 to avoid overbought conditions).
When the defined conditions for Buy or Sell are met, visual signals (labels) are plotted on the chart.
How to Use:
Copy the code into the Pine Script editor in TradingView.
Save and apply the script to your 1-hour chart.
Look for:
"BUY" signals (green): Indicating potential upward trends or buying opportunities.
"SELL" signals (red): Indicating potential downward trends or selling opportunities.
This script is simple and focuses purely on providing actionable Buy/Sell signals based on two powerful indicators, making it ideal for traders who prefer a clean chart without clutter. Let me know if you need further customization!

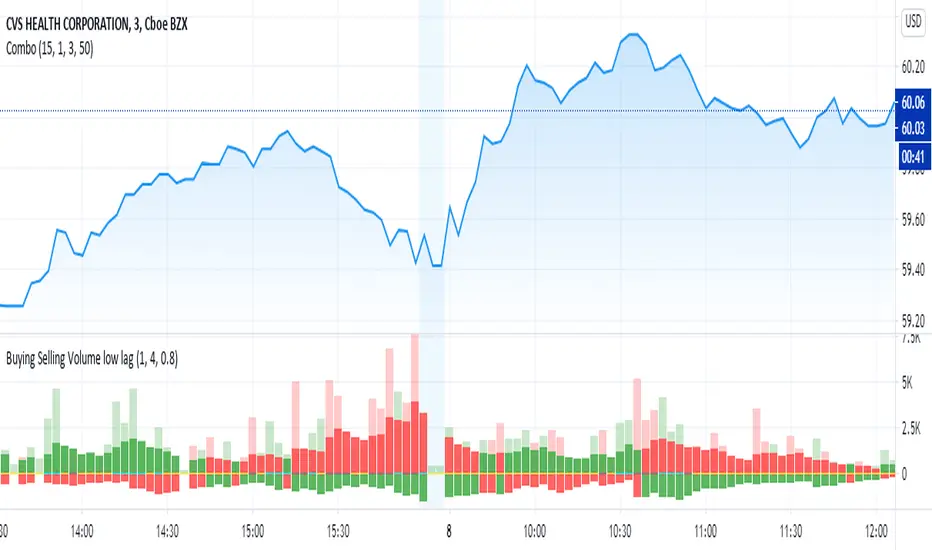
Buy-Sell Volume Bar Gauge [By MUQWISHI]▋ INTRODUCTION :
The Buy-Sell Volume Bar Gauge is developed to provide traders with a detailed analysis of volume in bars using a low timeframe, such as a 1-second interval, to measure the dominance of buy and sell for each bar. By highlighting the balance between buying and selling activities, the Buy-Sell Volume Bar Gauge helps traders identify potential volume momentum of a bar; aimed at being a useful tool for day traders and scalpers.
_______________________
▋ OVERVIEW:
_______________________
▋ METHODOLOGY:
The concept is based on bars from a lower timeframe within the current chart timeframe bar, where volume is categorized into Up, Down, and Neutral Volume, with each one displayed as a portion of a column plot. Up Volume is recorded when the price experiences a positive change, Down Volume occurs when the price experiences a negative change, and Neutral Volume is observed when the price shows no significant change.
_______________________
▋ INDICATOR SETTINGS:
(1) Fetch data from the selected lower timeframe. Note: If the selected timeframe is invalid (higher than chart), the indicator will automatically switch to 1 second.
(2) Price Source.
(3) Treating Neutral Data (Price Source) as
Neutral: In a lower timeframe, when the bar has no change in its price, the volume is counted as Neutral Volume.
Previous Move: In a lower timeframe, when the bar has no change in its price, the volume is counted as the previous change; “Up Volume” if the previous change was positive, and “Down Volume” if the previous change was negative.
Opposite Previous Move: In a lower timeframe, when the bar has no change in its price, the volume is counted as the opposite previous change; “Up Volume” if the previous change was negative, and “Down Volume” if the previous change was positive.
(4) Average Volume Length, it's used for lighting/darkening columns in a plot.
(5) Enable Alert.
(7) Total bought (%) Level.
(8) Total Sold (%) Level.
_____________________
▋ COMMENT:
The Buy-Sell Volume Bar Gauge can be taken as confirmation for predicting the next move, but it should not be considered a major factor in making a trading decision.

Buying - Selling StrengthThis script is designed as a TradingView indicator called "Buying Selling Volume". It aims to provide insights into buying and selling pressures in the market, along with the comparison of these pressures against moving averages.
Calculation of Buying and Selling Volumes:
Buying Volume (BV) is calculated based on the difference between the close price and the low price, weighted by the volume traded.
Selling Volume (SV) is calculated based on the difference between the high price and the close price, weighted by the volume traded.
These volumes are normalized to ensure positive values.
Plotting of Buying and Selling Volumes:
The script plots the Buying Volume (green) and Selling Volume (red) on the chart using vertical bars.
Each bar represents the relative strength of buying or selling pressure at a given point in time.
Moving Averages Calculation:
Users can select the type of moving average (SMA, EMA, WMA, or VWMA) and the length of each moving average.
Moving averages are calculated for both buying and selling volumes based on the selected parameters.
Plotting of Moving Averages:
The script plots the selected moving averages for buying (blue) and selling (orange) volumes on the chart.
These moving averages provide smoothed representations of the underlying volume trends.
Bar Color and Background Color:
The script dynamically adjusts the color of the bars and the background based on specific conditions:
If both buying and selling volumes are above their respective moving averages, the bar color is green, indicating a bullish signal.
If both volumes are below their moving averages, the bar color is red, indicating a bearish signal.
If buying volume is above its moving average while selling volume is below its moving average, the bar color is yellow, suggesting mixed market sentiment.
Otherwise, the bar color is gray, indicating a neutral market condition.

Buy/Sell Signal Template/Boilerplate [MyTradingCoder]This script allows the user to connect an external indicator output/plot value to allow for a no-code solution to setup a simple buy/sell signal indicator. For those of you who do not know how to program, do not be intimidated as this is a very easy setup process.
Maybe you want to buy when the 'RSI' value drops below '30' and then sell when the 'RSI' value climbs above '70', but you don't want to code it. You can do that with this indicator along with thousands of others found on the free TradingView indicator library.
Step #1:
Put the indicator on the chart.
Step #2:
Apply a secondary indicator onto the chart, such as an RSI.
Step #3:
Open the indicator settings and change the source to the RSI
Step #4:
Change the 'Signal Settings' to match when you want a buy, or a sell. For example, if you want to get a buy signal when the RSI crosses above 50, and get a sell when it crosses below 50, set the 'buy value' to 50, and the 'buy type' to greater than, then set the 'sell value' to 50 and the 'sell type' to less than. BOOM! It works :)

Buy/Sell ZonesEN:
This indicator is made to display main buy/sell zones of an asset. The core parameters are: Price, Volume and Donchian Channels.
It is more trend-based and may be suitable for swing traders or those who trade higher timeframes (1D and above).
The plotted colors display the dominance of buyers, sellers or indecision on the market at the current timeframe.
If the zone is green - consider opening Long/Buy positions.
If the zone is red - consider opening Short/Sell or scale out your position.
The white zone displays indecision between Bulls and Bears - consider not to take any trades within white zone.
RU:
Этот индикатор показывает зоны покупателя/продавца выбранного актива. Основные параметры расчета: Цена, Объем и Каналы Дончиана.
Он является индикатором трендового анализа и больше подходит для свинг-трейдеров или тех, кто торгует на старших таймфреймах (от 1Д).
Отображаемые цвета показывают доминацию продавца, покупателя или неопределенность на рынке в конкретный временной период.
Зеленая зона указывает на преобладание покупателя - возможно открытие длинных позиций/покупок .
Красная зона указывает на преобладание продавца - потенциальный момент для открытия коротких позиций/продаж или сокращения своих длинных позиций/покупок .
Белая зона указывает на неопределенность на рынке - в этой зоне лучше не предпринимать никаких торговых решений .
EN: This indicator may be used for Crypto markets
RU: Этот индикатор можно использовать для криптовалютных рынков
BITSTAMP:BTCUSD
BITSTAMP:ETHUSD
COINBASE:COMPUSD
EN: Stocks, CFD and commodities
RU: Акций, CFD и рынков сырьевых товаров
FOREXCOM:SPXUSD
NASDAQ:TSLA
NYSE:BA
NASDAQ:EBAY
FOREXCOM:XAUUSD
EN: Consider using it with respect to Your trading style, money- and risk-management as well as other indicators
RU: Используйте этот индикатор в соответствии со своим стилем торговли, риск-, мани-менеджментом и другими индикаторами.

Buying Selling Volume low lagOriginally written by @ceyhun
I added a low lag filter to key components to smooth the bars. The user can adjust the parameters 'fast' and 'slow' to tune.
capam
The original comments of ceyhun are below repeated:
Buying Selling Volume
-Buy Volume
-Sell Volume
-Buy Volume Percent %
-Sell Volume Percent %
-Volume Index
-Buy Sell Volume-
BuyVolume>SellVolume=Blue barcolor
SellVolume>BuyVolume=Purple barcolor
-Volume Index-
VolumeIndex>length and close > open =Cyan barcolor
VolumeIndex>length and close < open =Gray barcolor
VolumeIndex<=length = Yellow barcolor
BUY SELL Signal based on BB over RSI 14I have applied Bollinger Bands over Relative strength Index ( RSI 14). based on crossovers, i am applying buy or sell. Also, exit indicator for buy/sell position. Please let me know your thoughts on this.
Declaimer: This is completely based on my knowledge and observations only. NOT A TRADING STRATEGY SUGGESTION. Please consider my post as just educational purpose only.

Buy/sell signals & Top/Bottom • IntradayAnyone can trade with the Intraday indicator. Perfect for Day trading, Swing trading and scalping
How does the script work ?
The LONG and SHORT signals are clearly identifiable with colored candlesticks.
Find the potential Top and bottom on any interval.
Add alerts
All time intervals
The intraday script is working on any assets (Forex, Crypto, Indices, Stocks…)
Every new account gets a free 7-day trial.
The indicator is available via subscription and you can enjoy a 7-day free trial . To know more about the indicator and start the trial simply visit the link below.

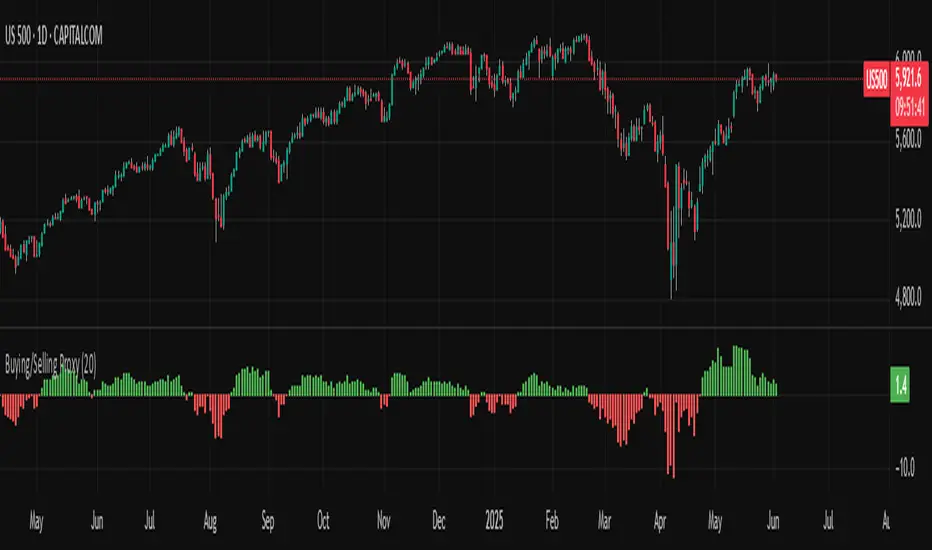
Buying/Selling ProxyTiltFolio Buying/Selling Proxy
This simple but effective indicator visualizes short-term buying or selling pressure using log returns over a rolling window.
How It Works:
Calculates the average of logarithmic returns over the past N bars (default: 20).
Positive values suggest sustained buying pressure; negative values indicate selling pressure.
Plotted as a color-coded histogram:
✅ Green = net buying
❌ Red = net selling
Why Use It:
This proxy helps traders gauge directional bias and momentum beneath the surface of price action — especially useful for confirming breakout strength, timing entries, or filtering signals.
- Inspired by academic return normalization, but optimized for practical use.
- Use alongside TiltFolio's Breakout Trend indicator for added context.
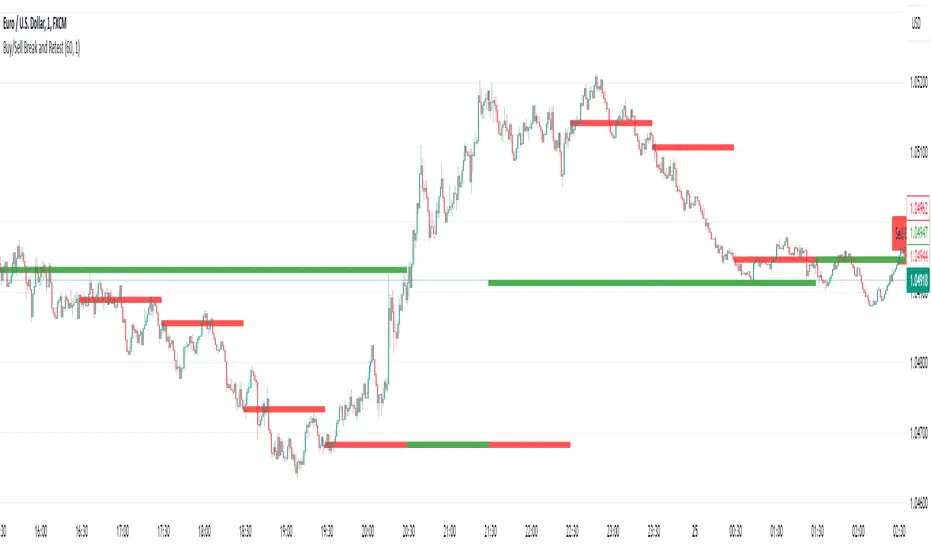
Buy/Sell Break and RetestThis script is a Pine Script indicator for TradingView titled **"Buy/Sell Break and Retest"**. Here's a description of its functionality:
### Purpose:
The script identifies potential **buy** and **sell entry levels** based on break-and-retest patterns in the market. It works by analyzing higher timeframe data (e.g., 1-hour) and marking entries on a lower timeframe (e.g., 1-minute).
### Key Features:
1. **Configurable Timeframes**:
- `Analysis Timeframe`: Used for identifying break-and-retest signals (default: 1-hour).
- `Entry Timeframe`: Used for marking and plotting entries (default: 1-minute).
2. **Buy and Sell Signals**:
- A **sell entry** is triggered when a bearish candle (close < open) is identified in the analysis timeframe.
- A **buy entry** is triggered when a bullish candle (close > open) is identified in the analysis timeframe.
3. **Retest Logic**:
- For sell signals: The retest is validated when the price breaks below the identified sell level.
- For buy signals: The retest is validated when the price breaks above the identified buy level.
4. **Visual Indicators**:
- Entry levels are marked with labels:
- **Buy Entry**: Green labels are placed at bullish candle opens.
- **Sell Entry**: Red labels are placed at bearish candle closes.
- Plots the levels for easy reference:
- **Sell Level**: Displayed as red circles on the chart.
- **Buy Level**: Displayed as green circles on the chart.
5. **Dynamic Updates**:
- Levels are cleared when invalidated by the price action.
### Use Case:
This indicator helps traders spot break-and-retest opportunities by:
- Allowing higher timeframe analysis to determine trend direction and key levels.
- Providing actionable buy and sell entry points on lower timeframes for precision.
Let me know if you'd like further clarification or improvements!
buy/sell signals with Support/Resistance (InvestYourAsset) 📣The present indicator is a MACD based buy/sell signals indicator with support and resistance, that can be used to identify potential buy and sell signals in a security's price.
📣It is based on the MACD (Moving Average Convergence Divergence) indicator, which is a momentum indicator that shows the relationship between two moving averages of a security's price.
📣 The indicator also plots support and resistance levels, which can be used to confirm buy and sell signals. The support and resistance can also be used as a stoploss for existing position.
👉 To use the indicator, simply add it to your trading chart. The indicator will plot three sections:
📈 Price and Signals: This section plots the security's price and the MACD buy and sell signals.
📈 MACD Oscillator: This section plots the MACD oscillator, which is a histogram that shows the difference between the two moving averages.
📈 Moving Averages: This section plots the two moving averages that the MACD oscillator is based on.
📈 Support and Resistance: This section plots support and resistance levels, which are calculated based on the security's recent price action.
👉 To identify buy and sell signals, you can look for the following:
📈 Buy signal: When shorter Moving Average crosses over longer Moving Average.
📈 Sell signal: When shorter moving average crosses under longer moving average.
📈 You can also look for divergences between the MACD oscillator and the security's price. A divergence occurs when the MACD oscillator is moving in one direction, but the security's price is moving in the opposite direction. Divergences can be a sign of a potential trend reversal.
👉 To confirm buy and sell signals, you can look for support and resistance levels take a look at below snapshot. If a buy signal occurs at a support level, it is a stronger signal than if it occurs at a random price level. Similarly, if a sell signal occurs at a resistance level, it is a stronger signal than if it occurs at a random price level.
⚡ Here is a example of how to use the indicator to identify buy signal:
☑ Add the indicator to your trading chart.
☑Look for a buy signal when short MA crosses over Long MA.
☑Look for the buy signal to occur at a support level.
☑Enter a long position at the next candle.
☑Place a stop loss order below the support level.
☑Take profit when the MACD line crosses below the signal line, or when the security reaches a resistance level.
⚡ Here is an example of how to use the indicator to identify a sell signal:
☑Add the indicator to your trading chart.
☑Look for a sell signal, when shorter moving average crosses under longer moving average.
☑Look for the sell signal to occur at a resistance level.
☑Enter a short position at the next candle.
☑Place a stop loss order above the resistance level.
☑Take profit when the MACD line crosses above the signal line, or when the security reaches a support level.
✅Things to consider while using the indicator:
📈Look for buy signals in an uptrend and sell signals in a downtrend. This will increase the likelihood of your trades being successful.
📈Place your stop losses below the previous swing low or support for buy signals and above the previous swing high or resistance for sell signals. This will help to limit your losses if the trade goes against you.
📈Consider taking profits at key resistance and support levels. This will help you to lock in your profits and avoid giving them back to the market.
Follow us for timely updates regarding indicators that we may publish in future and give it a like if you appreciate the indicator.

Buy/Sell Toolkit (Expo)█ Overview
The Buy/Sell Toolkit is a comprehensive trading tool designed to provide a holistic approach to trading. It brings together essential trading indicators and features in one place, simplifying the trading process and offering valuable insights into the market.
The indicator serves as an all-inclusive solution for traders seeking in-depth technical insights. While the Buy/Sell Toolkit can be utilized alongside other technical analysis methods, it can also be used as a standalone toolkit, adaptable to any trading style. In addition, each feature is thoughtfully integrated because not all technical indicators are suitable for every market condition or trading style.
The Buy/Sell toolkit works in any market and timeframe for discretionary analysis and includes many features:
█ Features
Buy/Sell signals: This feature provides real-time Buy/Sell trading signals for any market and timeframe. These signals are based on the trend.
Contrarian Signals: This feature provides real-time contrarian signals to take a position against the prevailing market trend.
Ultimate Trend: This feature assists in identifying the overall trend of the market, recognizing whether the market is in an uptrend, downtrend, or sideways.
Trend Advisor: The Trend Advisor helps traders understand the trend's strength, duration, and direction.
Trend Reversal: This feature identifies potential points where the current market may reverse within a trend. It's basically a trend-following line based on reversal calculation; it helps traders catch trend continuation setups.
Momentum Average: This indicator measures the rate of change in prices to identify the strength of the current trend. It can be beneficial for spotting potential price breakouts or warning of a market slowdown and pullbacks.
Take Profit Points: This feature suggests optimal points to exit a trade and lock in profits. It determines these points by using various factors such as volatility, support and resistance levels, and historical price movements.
Candle Coloring, Arithmetic Candlesticks, including Arithmetic Heikin Ashi: This feature provides an excellent visual aid to assist traders in recognizing patterns, identifying trends, and optimizing their trading strategies. The Arithmetic Candlesticks help smooth out price volatility and identify market trends more clearly.
Reversal Cloud: This innovative feature provides a graphical representation of potential price reversal zones. The cloud helps traders visualize where the price might reverse its trend.
Trend Cloud: Similar to the Reversal Cloud, this feature visualizes the prevailing market trend, making it easy for traders to understand the direction of the market at a glance.
Signal Optimizer: The Signal Optimizer is a powerful tool that optimizes the Buy/Sell and contrarian signals based on win-rate or performance. It automatically applies the best settings to the signals, freeing traders from the task of constantly adjusting them. This helps traders to get the most reliable signals automatically, enhancing their trading efficiency.
█ How to use the Buy/Sell Toolkit?
Here are a few illustrative examples to provide traders with a better understanding of the Toolkit's practical usage. These examples showcase the combination of features, but it's important to note that they serve as demonstrations, and we encourage traders to explore and adapt the features to align with their unique trading styles.
Buy/Sell Signals & Take Profit
Optimized Buy/Sell signals & Candle Color + Trend Advisor + Reversal Cloud
Contrarian Signals & Take Profit
,with Reversal Cloud
Optimized Contrarian Signals & Ultimate Trend & Reversal Cloud
Trend Cloud
Filter signals with Trend Cloud
█ Why is this Buy/Sell Toolkit Needed?
The Buy/Sell Toolkit is an exceptional tool for traders because it consolidates several critical trading indicators into a single, user-friendly platform. The Toolkit's holistic approach to market analysis can enhance decision-making, reduce guesswork, and improve overall trading performance. Additionally, it allows traders to customize their approach according to the market conditions and their trading style.
The Toolkit's automated features, such as the Signal Optimizer, save time and effort, making it easier for both new and experienced traders. In addition, its comprehensive suite of features ensures traders have all the information they need to make informed trading decisions. All these features make the Buy/Sell Toolkit a powerful ally in any trader's arsenal.
Here's why this Toolkit is essential:
Comprehensive Market Analysis: The Toolkit offers a wide range of indicators and tools for comprehensive market analysis, from trend detection to momentum analysis. This reduces the need for multiple tools and allows for a more efficient trading process. By providing a host of indicators like Buy/Sell signals, Contrarian Signals, Trend Analysis, and Momentum Average, the Toolkit helps traders make well-informed decisions based on comprehensive data and trend analysis.
Automation and Time-Saving: The Signal Optimizer automatically applies the best settings to the signals based on win rate or performance. This saves time and ensures the signals' reliability, reducing, it makes the trading process efficient and hassle-free.
Versatility: The Toolkit is versatile and can be used for various financial markets, including stocks, forex, commodities, or cryptocurrencies. Regardless of the market you trade in, the Buy/Sell Toolkit has something to offer.
Visual Tools: The Toolkit provides visual tools like Reversal Cloud, Trend Cloud, Trend lines, Candle coloring, and much more, which are excellent for visualizing market trends and potential reversal zones. This can make the process of understanding market movements more intuitive and less intimidating, especially for novice traders.
Confirmation: By using multiple indicators in conjunction with each other, traders can confirm signals and improve the accuracy of their trades.
Learning and Development: The Toolkit serves as an excellent resource for both novice and experienced traders to learn about different trading indicators, how they interact, and how to use them effectively.
█ Any Alert Function Call
This function allows traders to combine any feature and create customized alerts. These alerts can be set for various conditions and customized according to the trader's strategy or preferences.
█ How are the features calculated? - Overview
The Toolkit combines many of our existing premium indicators and new technical analysis algorithms to analyze the market. This overview covers how the main features are calculated.
Buy/Sell
The core function calculates the Exponential Weighting for a given time series X over a period T. The time series is based on absolute price changes. It focuses on the magnitude of price changes from one period to the next, irrespective of the direction (up or down). This type of time series can be used to measure the volatility of a price series, as it quantifies the size of price movements. It's useful in scenarios where the direction of the change is not as important as the magnitude of the change.
Contrarian Signals
Our contrarian signals are based on deviation from the expected range value. The algorithm quantifies the amount of variation or dispersion in a set of trading ranges. Non-expected values are the fundamental core of the signal generation process.
Ultimate Trend
The Ultimate trend calculates an adaptive smoothing momentum function by first determining the directional price movement and then applying smoothing to the positive and negative price changes. It then uses these values to calculate a form of Variable Moving Average (VMA), where the smoothing factor is adjusted based on a normalized measure of the relative difference between the Positive and Negative Directional values.
Trend Advisor
It's a form of Moving Averages that are applied to the price chart using three different weighting functions, simple weighting, price volatility smoothing constant weighting, and the traditional EMA weighting function.
Trend Reversal and Cloud
The function uses the information on how much the current price compared to the relative historical price fluctuates over a specific period and automatically updates its equilibrium value at new price changes.
Momentum Average
Essentially, it uses a modified version of the relative rate of change over a certain period.
Take Profit
The take profit uses similar range price functions as the contrarian signals, where a take profit signal is triggered at extremely abnormal values.
Candles
Note, Using and Backtesting on non-standard charts produces unrealistic results since it does not represent the closing price. The candles are based on a smoothing process that finds the best smoothing coefficient for the current data, using close as time series.
█ In conclusion , The Buy/Sell Toolkit serves as a comprehensive, user-friendly, and efficient trading assistant. It brings automation and intelligent data play-by-play to your fingertips, making it an essential tool for anyone serious about trading.
-----------------
Disclaimer
The information contained in my Scripts/Indicators/Ideas/Algos/Systems does not constitute financial advice or a solicitation to buy or sell any securities of any type. I will not accept liability for any loss or damage, including without limitation any loss of profit, which may arise directly or indirectly from the use of or reliance on such information.
All investments involve risk, and the past performance of a security, industry, sector, market, financial product, trading strategy, backtest, or individual's trading does not guarantee future results or returns. Investors are fully responsible for any investment decisions they make. Such decisions should be based solely on an evaluation of their financial circumstances, investment objectives, risk tolerance, and liquidity needs.
My Scripts/Indicators/Ideas/Algos/Systems are only for educational purposes!
Script de pago

Buy/Sell singal with RSI, MA, RSI DIV1. Overview
I'll explain a strategy that uses the simple but powerful technical analysis techniques RSI, MA, VOLUME, and RSI Divergence to identify Buy/Sell signals. This strategy utilizes Pine Script of TradingView.
Our strategy is based on four fundamental components.
- RSI (Relative Strength Index)
- MA (Moving Averages)
- Volume
- RSI Divergence
By using these four techniques together, we can find potential buy/sell signals.
2. Code Interpretation
To understand the TradingView code we used, let's examine each section one by one.
- RSI Calculation: RSI is a technical indicator that measures the relative strength of a price and is often used to identify overbought or oversold conditions. In our code, we calculate the RSI over a given period.
- Moving Averages: This code calculates short-term and long-term moving averages. Moving averages represent the average price over a specific period and are used to identify long-term price trends. Their intersections are considered potential buy/sell signals.
- RSI Divergence: RSI divergence represents a mismatch between the price trend and the RSI trend. It occurs when the price makes a new high or low, but the RSI does not. This indicates a weakening of the price trend and is considered a powerful signal of trend change.
- Volume Calculation: When the volume of transactions occurring during a specific period is x times more than the average volume, it is considered a signal of trend change.
- Buy/Sell Signals: Each technical indicator generates buy or sell signals. These signals are marked as labels on the chart. In our strategy, buy/sell signals are generated when the RSI exits overbought or oversold zones, when the moving averages cross, and when RSI divergence occurs.
3. Signal Detection
3.1 Buy/Sell Signals Using RSI
The RSI indicator has a value between 0 and 100, with values over 70 generally considered the overbought zone and those under 30 as the oversold zone.
A buy signal is generated when the RSI rises from the oversold zone.
Conversely, a sell signal is generated when the RSI falls from the overbought zone.
3.2 Detecting Buy/Sell Signals Through Moving Average Crosses
Moving averages help identify price trends.
A buy signal is generated when the short-term moving average crosses the long-term moving average upward.
Conversely, a sell signal is generated when the short-term moving average crosses the long-term moving average downward.
The color of each bar can be changed according to each signal.
3.3 Detecting Signals When Volume is X Times Higher Than Average
When the volume is x times higher than average, a marker is placed above each bar.
A green marker is displayed when the buy volume is high.
A red marker is displayed when the sell volume is high.
4. Conclusion
This technical analysis strategy is very simple but effective. Using RSI, moving averages, volume, and RSI divergence, you can find effective buy/sell signals.
By leveraging Pine Script in TradingView, you can easily apply this strategy and find signals in real-time.
Always remember that risk management is important in trading. This strategy may not be effective in all market conditions, so always use appropriate risk management strategies alongside it.
----------------------------------------------------------------------------------------------------------------------------------------------------------------------------------------------------------------------------------------------------------------------------------------------
1. 개요
간단하지만 강력한 기술적 분석 전략인 RSI, MA, VOLUME, RSI Divergence를 사용한 Buy/Sell 신호 표시 전략에 대해 설명드리겠습니다.
이 전략은 트레이딩뷰의 Pine Script를 활용합니다.
우리의 전략은 다음 네 가지 기본 구성 요소에 기반합니다.
- RSI (Relative Strength Index)
- MA (Moving Averages)
- 거래량
- RSI Divergence
이 네 가지 기법을 함께 사용하여 잠재적인 매수/매도 신호를 찾아냅니다.
2. 코드 해석
우리가 사용한 트레이딩뷰 코드를 이해하기 위해 각 섹션을 하나씩 살펴보겠습니다.
RSI 계산: RSI는 가격의 상대적 강도를 측정하는 기술적 지표로, 과매수 또는 과매도 조건을 식별하는 데 자주 사용됩니다. 우리의 코드에서는 주어진 기간 동안의 RSI를 계산합니다.
이동평균: 이 코드에서는 단기 이동평균과 장기 이동평균을 계산합니다. 이동평균은 특정 기간 동안의 가격 평균을 나타내며, 가격의 장기적인 트렌드를 식별하는 데 사용됩니다. 이들의 교차점은 잠재적인 매수/매도 신호로 간주됩니다.
RSI Divergence: RSI 다이버전스는 가격 추세와 RSI 추세 사이의 불일치를 나타냅니다. 가격이 새로운 고점 또는 저점을 만들면서 RSI가 그렇지 않을 때 발생합니다. 이것은 가격 트렌드의 약화를 나타내며 강력한 트렌드 변화 신호로 간주됩니다.
VOLUME 계산 : 특정 구간동안의 평균 거래량보다 x배 이상 거래량이 많이 발생하였을때 트렌드 변화 신호로 간주됩니다.
매수/매도 신호: 각 기술적 지표는 매수 또는 매도 신호를 생성합니다. 이러한 신호는 차트에 라벨로 표시됩니다. 우리의 전략에서는 RSI가 과매도 또는 과매수 영역을 벗어날 때, 이동평균이 교차할 때, 그리고 RSI 다이버전스가 발생할 때 매수/매도 신호를 생성합니다.
3. 신호 감지
3.1 RSI를 활용한 매수/매도 신호
RSI 지표는 0에서 100 사이의 값을 가지며, 일반적으로 70 이상은 과매수 영역, 30 이하는 과매도 영역으로 간주됩니다.
과매도 영역에서 RSI가 상승하면 매수 신호가 생성됩니다.
반대로, 과매수 영역에서 RSI가 하락하면 매도 신호가 생성됩니다.
3.2 이동평균 교차로 매수/매도 신호 감지
이동평균은 가격의 트렌드를 식별하는 데 도움이 됩니다.
단기 이동평균이 장기 이동평균을 상승으로 교차하면 매수 신호가 생성됩니다.
반대로, 단기 이동평균이 장기 이동평균을 하락으로 교차하면 매도 신호가 생성됩니다.
각 신호에 따라 해당 봉의 색깔도 변경할 수 있습니다.
3.3 평균 거래량보다 x배 이상 거래량이 발생했을 때 신호 감지
평균 거래량보다 x배 이상 거래량이 발생했을 때 각 봉 위에 표시가 됩니다.
매수 거래량이 많을 경우 초록색으로 표시가 됩니다.
매도 거래량이 많을 경우 빨간색으로 표시가 됩니다.
* 모든 기준이 되는 수치와 색상은 설정에서 개인의 취향에 맞게 설정 가능합니다.
4. 결론
이 기술적 분석 전략은 매우 간단하지만 효과적입니다. RSI, 이동평균, 거래량, RSI 다이버전스를 사용하여 효과적인 매수/매도 신호를 찾을 수 있습니다.
트레이딩뷰의 Pine Script를 활용하여 이 전략을 쉽게 적용하고, 실시간으로 신호를 찾아낼 수 있습니다.
항상 거래에 있어서는 리스크 관리가 중요하다는 점을 명심하십시오. 이 전략이 모든 시장 상황에 효과적이지는 않을 수 있으므로, 항상 적절한 리스크 관리 전략을 함께 사용해야 합니다.
Buying/Selling Pressure Cycle (PreCy)No lag estimation of the buying/selling pressure for each candle.
----------------------------------------------------------------------------------------------------
WHY PreCY?
How much bearish pressure is there behind a group of bullish candles ?
Is this bearish pressure increasing?
When might it overcome the bullish pressure?
Those were my questions when I started this indicator. It lead me through the rabbit hole, where I discovered some secrets about the market. So I pushed deeper, and developped it a lot more, in order to understand what is really happening "behind the scene".
There are now 3 ways to read this indicator. It might look complicated at first, but the reward is to be able to anticipate and understand a lot more.
You can show/hide all the plots in the settings. So you can choose the way you prefer to use it.
----------------------------------------------------------------------------------------------------
FIRST WAY TO READ PreCy : The SIGNAL line
Go in the settings of PreCy, in "DISPLAY", uncheck "The pivot lines of the SIGNAL" and "The CYCLE areas". Make sure "The SIGNAL line" is checked.
The SIGNAL shows an estimation of the buying/selling pressure of each candle, going from 100 (100% bullish candle) to -100 (100% bearish candle). A doji would be shown close to zero.
Formula: Estimated % of buying pressure - Estimated % of selling pressure
It is a very choppy line in general, but its colors help make sense of it.
When this choppiness alternates between the extremes, then there is not much pressure on each candle, and it's very unpredictable.
When the pressure increases, the SIGNAL's amplitude changes. It "compresses", meaning there is some interest in the market. It can compress by alternating above and below zero, or it can stay above zero (bullish), or below zero (bearish) for a while.
When the SIGNAL becomes linear (in opposition to choppy), there is a lot of pressure, and it is directional. The participants agree for a move in a chosen direction.
The trajectory of the SIGNAL can help anticipate when a move is going to happen (directional increase of pressure), or stop (returning to zero) and possibly reverse (crossing zero).
Advanced uses:
The SIGNAL can make more sense on a specific timeframe, that would be aligned with the frequency of the orders at that moment. So it is a good idea to switch between timeframes until it gets less choppy, and more directional.
It is interesting to follow any regular progression of the SIGNAL, as it can reveal the intentions of the market makers to go in a certain direction discretely. There can be almost no volume and no move in the price action, yet the SIGNAL gets linear and moves away from one extreme, slowly crosses the zeroline, and pushes to the other extreme at the same time as the amplitude of the price action increases drastically.
----------------------------------------------------------------------------------------------------
SECOND WAY TO READ PreCy : The PIVOTS of the SIGNAL line
Go in the settings of PreCy, in "DISPLAY", and uncheck "The CYCLE areas". Make sure "The SIGNAL line" and "The pivot lines of the SIGNAL" are checked.
The PIVOTS help make sense of the apparent chaos of the SIGNAL. They can reveal the overall direction of the choppy moves.
Especially when the 2 PIVOTS lines are parallel and oriented.
----------------------------------------------------------------------------------------------------
THIRD WAY TO READ PreCy : The CYCLE
Go in the settings of PreCy, in "DISPLAY", and uncheck "The SIGNAL line" and "The pivot lines of the SIGNAL". Make sure "The CYCLE areas" is checked.
The CYCLE is a Moving Average of the SIGNAL in relation to each candle's size.
Formula: 6 periods Moving Average of the SIGNAL * (body of the current candle / 200 periods Moving Average of the candle's bodies)
The result goes from 200 to -200.
The CYCLE shows longer term indications of the pressures of the market.
Analysing the trajectory of the CYCLE can help predict the direction of the price.
When the CYCLE goes above or below the gray low intensity zone, it signals some interest in the move.
When the CYCLE stays above 100 or below -100, it is a sign of strength in the move.
When it stayed out of the gray low intensity zone, then returns inside it, it is a strong signal of a probable change of behavior.
----------------------------------------------------------------------------------------------------
ALERTS
In the settings, you can pick the alerts you're interested in.
To activate them, right click on the chart (or alt+a), choose "Add alert on Buying/Selling Pressure Cycle (PreCy)" then "Any alert()", then "Create".
Feel free to activate them on different timeframes. The alerts show which timeframe they are from (ex: "TF:15" for the 15 minutes TF).
I have added a lot more conditions to my PreCy, taken from FREMA Trend, for ex. You can do the same with your favorite scripts, to make PreCy more accurate for your style.
----------------------------------------------------------------------------------------------------
Borrowed scripts:
To estimate the buying and selling pressures, PreCy uses the wicks calculations of "Volume net histogram" by RafaelZioni
To filter the alerts, PreCy uses the calculations of "Amplitude" by Koholintian:
----------------------------------------------------------------------------------------------------
DO NOT BASE YOUR TRADING DECISIONS ON 1 SINGLE INDICATOR'S SIGNALS.
Always confirm your ideas by other means, like price action and indicators of a different nature.

Buy/Sell Pressure Raw// This is a port of the bar by bar Buy/Sell pressure indicator by Karthik Marar.
// See below link for further details.
// karthikmarar.blogspot.com
// The only difference being I used the Hull moving average instead of WMA which the HullMA is a derivative of.
// Credits to Chris Moody for the HullMA code.
// All disclaimers apply
BUY/SELL JorgeChutoFXThis indicator is ideal for:
• Identifying trend reversals with precision
• Confirming entries and exits in trend-following strategies
• Visualizing key breakouts above or below the Gann line
• Use in scalping, intraday trading, or swing trading
Includes:
✔ Gann High-Low line with automatic color change
✔ BUY/SELL text signals at key reversal points
✔ Adjustable text size
✔ Signals only on confirmed candle close
✔ No repainting
Use this indicator as a supportive tool. It does not guarantee results. Trading in financial markets involves risk.

Buy Sell SignalBuy Sell Signal - EMA Crossover with Dynamic Risk Management
OVERVIEW
This indicator combines a dual EMA crossover system with ATR-based dynamic stop loss and take profit levels to provide complete trade management signals. Unlike basic EMA crossover scripts, this tool automatically calculates and displays entry points, stop losses, and take profit targets based on market volatility, offering traders a complete trading framework in a single indicator.
HOW IT WORKS
The indicator uses three core components working together:
Trend Detection: A fast EMA (default 5) and slow EMA (default 13) identify trend direction. When the fast EMA crosses above the slow EMA, it signals bullish momentum; when it crosses below, it signals bearish momentum.
Entry Validation: Optional candle confirmation filter ensures the crossover is accompanied by a bullish/bearish candle close, reducing false signals in choppy markets.
Risk Management: Uses ATR (Average True Range, default 14 periods) to calculate:
Stop Loss: Positioned below/above recent swing low/high minus ATR multiplier (default 0.5x)
Take Profit: Calculated using customizable risk-reward ratio (default 3:1)
KEY FEATURES
✅ Automatic Position Tracking: Monitors active trades and displays current position status (LONG/SHORT/No position)
✅ Visual Trade Management: Shows entry price (white dashed line), stop loss (red line), and take profit (green line) in real-time
✅ Trade Outcome Signals: Displays clear markers when TP is hit (🎯), SL is triggered (❌), or position is invalidated by opposite signal
✅ Information Dashboard: Live table showing entry price, SL, TP, and actual R:R ratio
✅ Smart Position Invalidation: Automatically closes and invalidates previous positions when opposite trend signal appears
✅ Customizable Alerts: Five alert conditions for BUY/SELL signals, TP hits, SL triggers, and invalidations
INPUTS
Fast EMA Length (default 5): Responsive to recent price action
Slow EMA Length (default 13): Defines broader trend direction
ATR Period (default 14): Volatility measurement period
SL Multiplier (default 0.5): Distance from swing point to stop loss
Risk:Reward Ratio (default 3.0): Target profit relative to risk
Candle Confirmation (default ON): Requires bullish/bearish candle on crossover
HOW TO USE
Apply the indicator to your chart (works on all timeframes)
Adjust EMA periods based on your trading style (shorter for scalping, longer for swing trading)
Set your preferred risk-reward ratio
Enable alerts for automated notifications
When a BUY/SELL signal appears, the indicator automatically calculates and displays your complete trade plan
Monitor the information table for live position updates
Exit when TP is reached or SL is triggered
TRADING METHODOLOGY
This script implements a momentum-following strategy based on exponential moving average crossovers, enhanced with volatility-adjusted risk parameters. The ATR-based stop loss adapts to market conditions—wider stops in volatile markets, tighter stops in calm markets. The position invalidation feature prevents traders from holding outdated positions when market sentiment shifts.
BEST PRACTICES
Use on trending markets for best results
Higher timeframes (4H, Daily) produce fewer but more reliable signals.
For scalpe use 5 and 15 minutes(Risk).
Consider market context and fundamental factors alongside signals
Adjust ATR multiplier based on asset volatility
Test different EMA combinations for your preferred instruments
ORIGINALITY
While EMA crossover systems are common, this script's value lies in its complete integration of entry logic, dynamic risk management, position tracking, and automated invalidation—features typically requiring multiple separate indicators. The ATR-based stop loss calculation and automatic R:R visualization provide practical trade execution guidance that basic crossover indicators lack.
Important Notes:
This indicator does not guarantee profitable trades
Always practice proper risk management
Backtest settings on historical data before live trading
Past performance does not indicate future results